Financial Data (Two Fiscal Years)
Statements of income (IFRS)
IFRS basis
| 2022.3 | 2023.3 | |
|---|---|---|
| Revenue | 266,257 | 279,037 |
| Cost of sales | (109,671) | (112,950) |
| (Percent of revenue) (%) | 41.2 | 40.5 |
| Gross profit | 156,586 | 166,087 |
| (Percent of revenue) (%) | 58.8 | 59.5 |
| Selling, general and administrative expenses | (84,499) | (96,257) |
| (Percent of revenue) (%) | 31.7 | 34.5 |
| Research and development expenses | (26,377) | (28,297) |
| (Percent of revenue) (%) | 9.9 | 10.1 |
| Amortization on intangible assets associated with products | (9,734) | (9,518) |
| (Percent of revenue) (%) | 3.7 | 3.4 |
| Other income | 1,043 | 3,524 |
| Other expenses | (1,133) | (38,629) |
| Operating profit | 35,886 | (3,090) |
| (Percent of revenue) (%) | 13.5 | - |
| Finance income | 2,543 | 1,153 |
| Finance expenses | (1,209) | (1,499) |
| Share of loss of investments accounted for using equity method | (1,604) | (2,362) |
| Profit before tax | 35,616 | (5,799) |
| (Percent of revenue) (%) | 13.4 | - |
| Income tax expenses | (8,427) | (9,184) |
| Net profit for the year | 27,189 | (14,983) |
| (Percent of revenue) (%) | 10.2 | - |
| ROE (%) | 8.4 | - |
IFRS (Core basis)
| 2022.3 | 2023.3 | |
|---|---|---|
| Revenue | 266,257 | 279,037 |
| Cost of sales | (109,671) | (112,950) |
| (Percent of revenue) (%) | 41.2 | 40.5 |
| Gross profit | 156,586 | 166,087 |
| (Percent of revenue) (%) | 58.8 | 59.5 |
| Selling, general and administrative expenses | (83,861) | (93,548) |
| (Percent of revenue) (%) | 31.5 | 33.5 |
| Research and development expenses | (26,377) | (28,297) |
| (Percent of revenue) (%) | 9.9 | 10.1 |
| Operating profit | 46,348 | 44,242 |
| (Percent of revenue) (%) | 17.4 | 15.9 |
| Net profit for the year | 35,159 | 33,235 |
| (Percent of revenue) (%) | 13.2 | 11.9 |
| ROE (%) | 10.9 | 10.5 |
Statement of financial position (IFRS)
Assets
| 2022.3 | 2023.3 | |||
|---|---|---|---|---|
| % | % | |||
| Non-current assets | ||||
| Property, plant and equipment | 56,287 | 12.2 | 66,173 | 15.7 |
| Intangible assets | 130,217 | 28.3 | 96,309 | 22.9 |
| Financial assets | 28,673 | 6.2 | 28,038 | 6.7 |
| Retirement benefit asset | 3,011 | 0.7 | 3,438 | 0.8 |
| Investments from application of equity method | 7,565 | 1.6 | 9,321 | 2.2 |
| Deferred tax assets | 3,103 | 0.7 | 2,810 | 0.7 |
| Other non-current assets | 1,695 | 0.4 | 1,763 | 0.4 |
| Total non-current assets | 230,551 | 50.1 | 207,853 | 49.4 |
| Current assets | ||||
| Inventories | 37,141 | 8.1 | 39,352 | 9.3 |
| Trade and other receivables | 99,591 | 21.7 | 107,165 | 25.4 |
| Other financial assets | 1,293 | 0.3 | 774 | 0.2 |
| Income tax receivable | - | - | 60 | 0.0 |
| Other current assets | 8,387 | 1.8 | 8,072 | 1.9 |
| Cash and cash equivalents | 83,014 | 18.0 | 57,903 | 13.7 |
| Total current assets | 229,426 | 49.9 | 213,326 | 50.6 |
| Total assets | 459,976 | 100.0 | 421,179 | 100.0 |
Equity and liabilities
| 2022.3 | 2023.3 | |||
|---|---|---|---|---|
| % | % | |||
| Equity | ||||
| Share capital | 8,672 | 1.9 | 8,702 | 2.1 |
| Capital surplus | 9,370 | 2.0 | 9,789 | 2.3 |
| Treasury shares | (718) | (0.2) | (364) | (0.1) |
| Retained earnings | 290,477 | 63.2 | 238,071 | 56.5 |
| Other components of equity | 29,688 | 6.5 | 37,781 | 9.0 |
| Total equity attributable to owners of the parent | 337,488 | 73.4 | 293,979 | 69.8 |
| Non-controlling interests | (645) | (0.1) | (683) | (0.2) |
| Total equity | 336,844 | 73.2 | 293,297 | 69.6 |
| Liabilities | ||||
| Non-current liabilities | ||||
| Financial liabilities | 22,023 | 4.8 | 33,513 | 8.0 |
| Net defined benefit liabilities | 1,077 | 0.2 | 1,271 | 0.3 |
| Provisions | 738 | 0.2 | 691 | 0.2 |
| Deferred tax liabilities | 2,526 | 0.5 | 1,592 | 0.4 |
| Other non-current liabilities | 948 | 0.2 | 1,312 | 0.3 |
| Total non-current liabilities | 27,312 | 5.9 | 38,378 | 9.1 |
| Current liabilities | ||||
| Trade and other payables | 41,185 | 9.0 | 44,945 | 10.7 |
| Other financial liabilities | 38,533 | 8.4 | 25,858 | 6.1 |
| Income tax payable | 4,198 | 0.9 | 6,745 | 1.6 |
| Provisions | 939 | 0.2 | 4,212 | 1.0 |
| Other current liabilities | 10,965 | 2.4 | 7,744 | 1.8 |
| Total current liabilities | 95,821 | 20.8 | 89,504 | 21.3 |
| Total liabilities | 123,133 | 26.8 | 127,883 | 30.4 |
| Total equity and liabilities | 459,976 | 100.0 | 421,179 | 100.0 |
Consolidated Statements of Cash Flows (IFRS)
| 2022.3 | 2023.3 | |
|---|---|---|
| Net cash flows from operating activities | 46,043 | 37,147 |
| Net cash flows from (used in) investing activities | (35,169) | (26,777) |
| Net cash flows from (used in) financing activities | 5,557 | (37,220) |
| Net increase (decrease) in cash and cash equivalents | 16,432 | (26,850) |
| Cash and cash equivalents at beginning of period | 62,888 | 83,014 |
| Effect of exchange rate changes on cash and cash equivalents | 3,694 | 1,739 |
| Cash and cash equivalents at end of period | 83,014 | 57,903 |
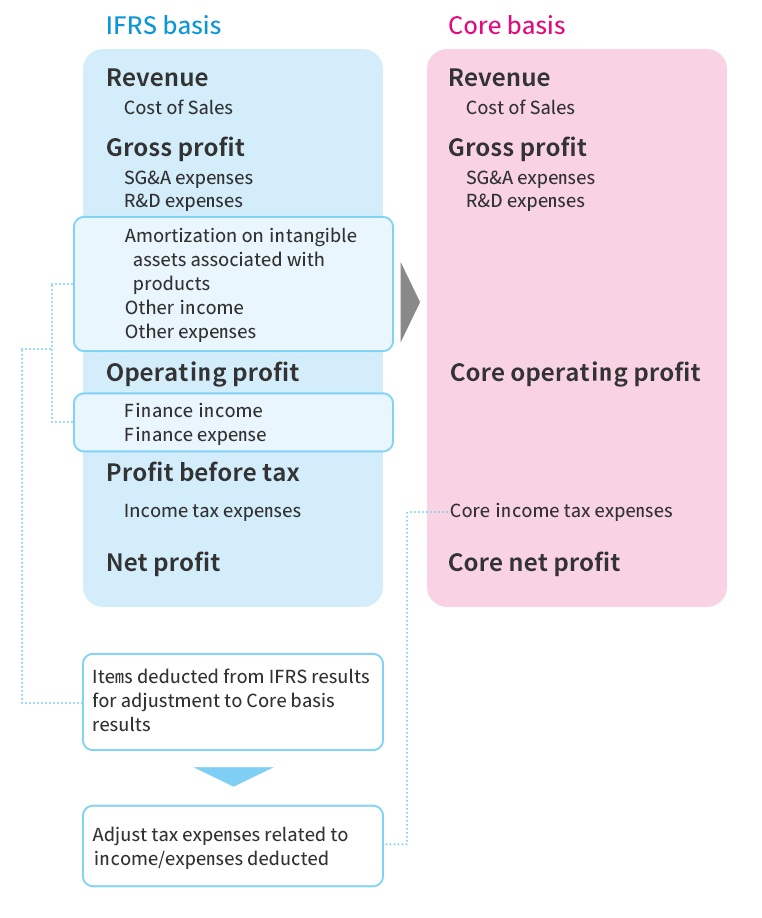
(Reference) Accounting Standards and Definition of "Core Base"
With the adoption of IFRS, the Santen Group discloses financial information on a core basis, which is calculated by excluding certain income and expenses item from the IFRS basis, as an indicator of profitability from business activities.