Environmental Data 2022
The performance indicators such as Scope 1, Scope 2, and Scope 3 Category 2 and Category 3 of environmental data are assured by a third party to improve reliability.
Overview of Environmental Load (2021)
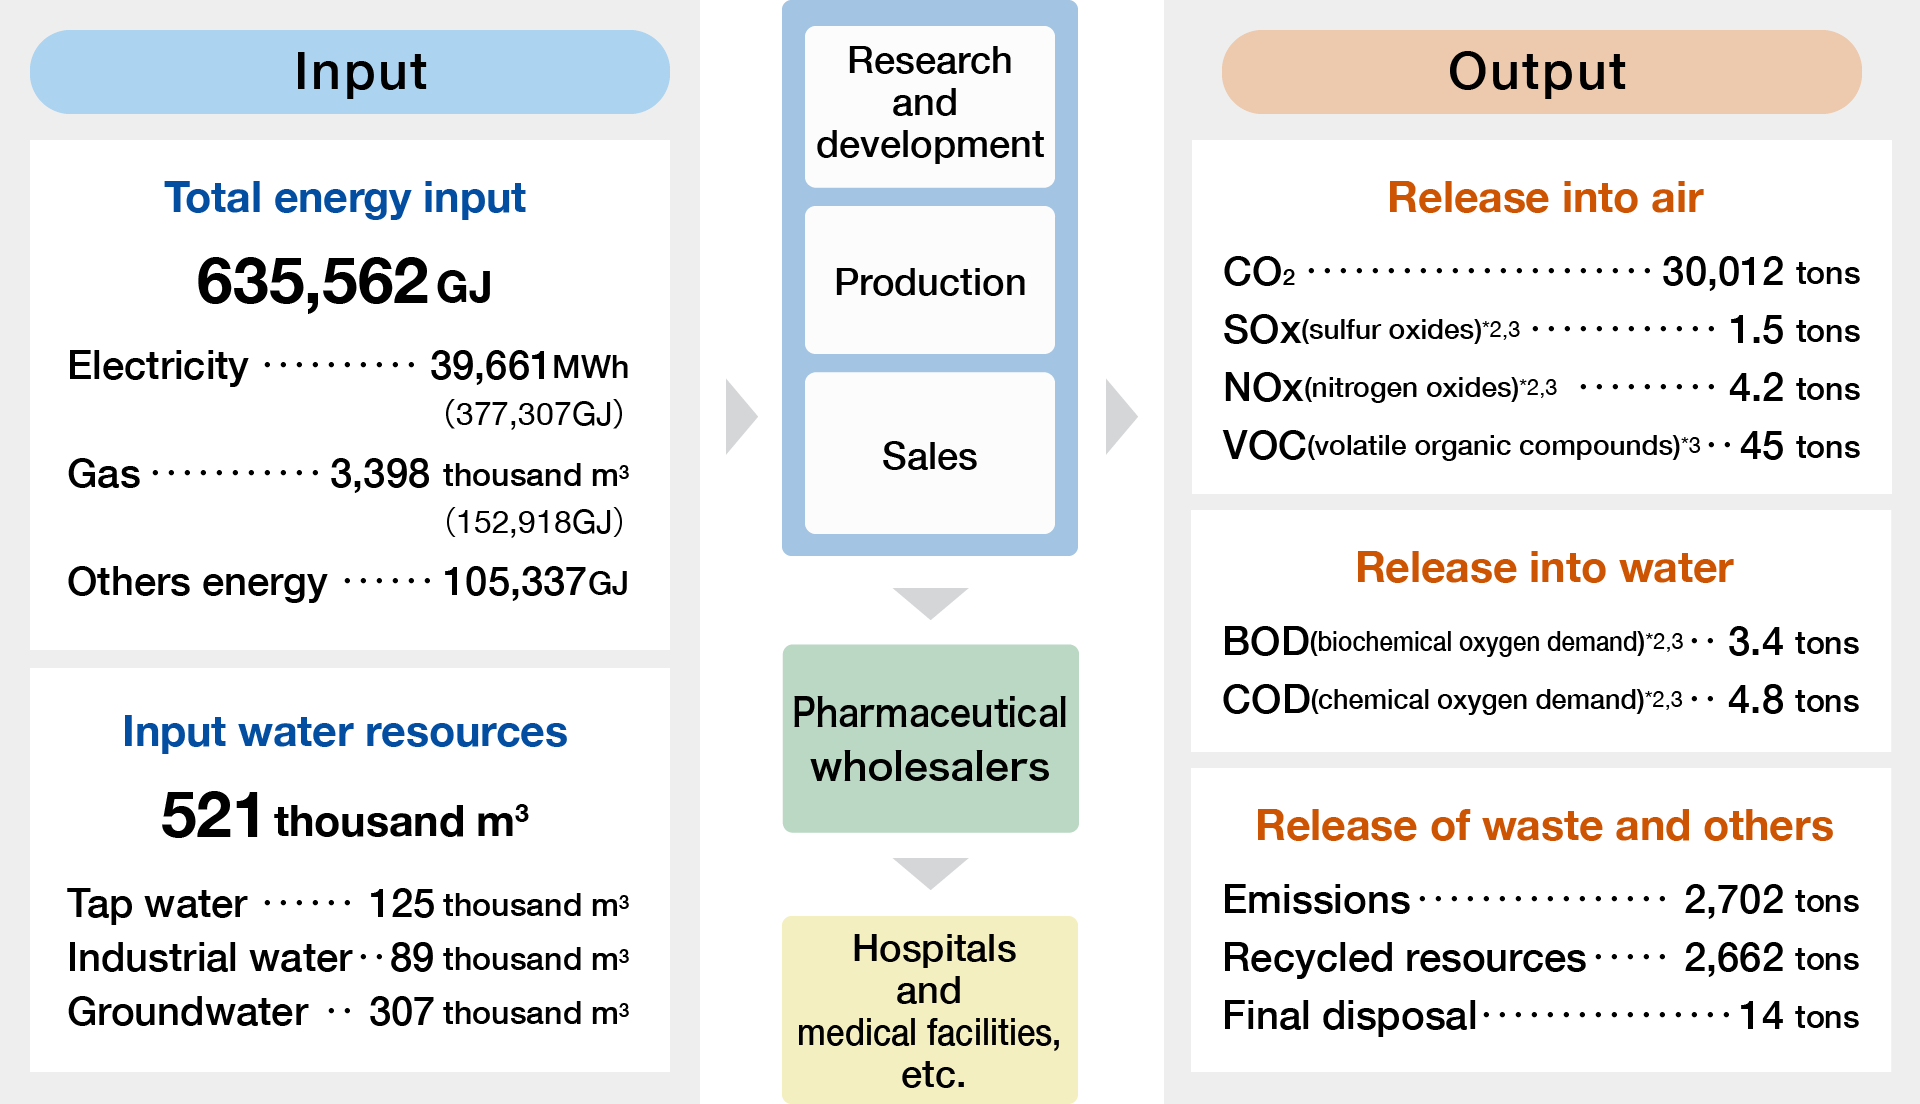
Measures against Climate Change
Greenhouse gas (CO2) emissions trend by scope
| FY2017 | FY2018 | FY2019 | FY2020(1) | FY2021(2) | % Change (2) / (1) | |
|---|---|---|---|---|---|---|
| Santen Group(*1) | 33,371 | 34,160 | 34,767 | 34,025 | 30,012 | -11.8 |
| Scope1 | 16,811 | 17,018 | 15,296 | 14,860 | 14,820 | -0.3 |
| Scope2 (Market-based) | - | - | 19,471 | 19,165 | 15,192 | -20.7 |
| Scope2 (Location- based) | 16,560 | 17,142 | 20,187 | 19,566 | 18,525 | -5.3 |
| CO2 emissions per unit of revenue(*2) [t-CO2/billion yen] | 148 | 146 | 144 | 136 | 113 | -16.9 |
With the setting of the 2030 target, the boundary and CO2 conversion factors have been revised to the SBT standard and retroactively revised from FY2019 onward.
- Total value of Scope 1 + Scope 2 (Market-based) from FY2019.
- From FY2019 onward, CO2 emissions per unit of revenue is calculated as the total of Scope 1 + Scope 2 (Market-based).
| FY2017 | FY2018 | FY2019 | FY2020(1) | FY2021(2) | % Change (2) / (1) | |
|---|---|---|---|---|---|---|
| Shimoshinjo Office | 244 | 208 | 182 | 150 | 149 | -0.5 |
| Scope1 | - | - | 0 | 0 | 0 | - |
| Scope2 (Market-based) | - | - | 182 | 150 | 149 | -0.5 |
| Scope2 (Location- based) | - | - | 251 | 210 | 184 | -12.3 |
| Noto Plant | 10,985 | 11,072 | 14,764 | 14,919 | 11,278 | -24.4 |
| Scope1 | - | - | 5,744 | 5,960 | 5,444 | -8.6 |
| Scope2 (Market-based) | - | - | 9,021 | 8,960 | 5,834 | -34.9 |
| Scope2 (Location- based) | - | - | 7,908 | 7,566 | 7,087 | -6.3 |
| Shiga Product Supply Center | 6,802 | 6,860 | 6,386 | 6,297 | 5,775 | -8.3 |
| Scope1 | - | - | 3,388 | 3,478 | 3,420 | -1.7 |
| Scope2 (Market-based) | - | - | 2,998 | 2,818 | 2,355 | -16.4 |
| Scope2 (Location- based) | - | - | 4,146 | 3,944 | 3,771 | -4.4 |
| Nara Research and Development Center | 4,151 | 4,112 | 4,216 | 4,026 | 4,070 | 1.1 |
| Scope1 | - | - | 2,624 | 2,499 | 2,672 | 6.9 |
| Scope2 (Market-based) | - | - | 1,592 | 1,527 | 1,398 | -8.5 |
| Scope2 (Location- based) | - | - | 2,203 | 2,137 | 2,027 | -5.1 |
| Branch and Sales offices and others | 2,685 | 2,552 | 2,613 | 1,948 | 2,131 | 9.4 |
| Scope1 | - | - | 2,028 | 1,441 | 1,676 | 16.3 |
| Scope2 (Market-based) | - | - | 585 | 507 | 455 | -10.3 |
| Scope2 (Location- based) | - | - | 585 | 507 | 455 | -10.3 |
| Suzhou Plant | 6,830 | 7,747 | 6,606 | 6,685 | 6,609 | -1.1 |
| Scope1 | - | - | 1,513 | 1,482 | 1,608 | 8.5 |
| Scope2 (Market-based) | - | - | 5,093 | 5,202 | 5,000 | -3.9 |
| Scope2 (Location- based) | - | - | 5,093 | 5,202 | 5,000 | -3.9 |
With the setting of the 2030 target, the boundary and CO2 conversion factors have been revised to the SBT standard and retroactively revised from FY2019 onward.
In addition, data for Scope 1 and 2 are also listed from FY2019.
| Category | FY2017 | FY2018 | FY2019 | FY2020(1) | FY2021(2) | % Change (2) / (1) |
|---|---|---|---|---|---|---|
| 1: Purchased goods and services | 137,102 | 142,215 | 147,531 | 160,113 | 165,569 | 3.4 |
| 2: Capital goods | 11,275 | 15,480 | 16,480 | 11,712 | 49,077 | 319.0 |
| 3: Fuel and energy related activities not included in Scope1 and Scope2 | 1,098 | 1,099 | 2,211 | 2,189 | 2,119 | -3.2 |
| 4: Transportation and distribution (Upstream) | 708 | 630 | 763 | 565 | 517 | -8.5 |
| 5: Waste generated in operation | 410 | 440 | 489 | 446 | 316 | -29.1 |
| 6: Business travel | 2,894 | 2,763 | 2,041 | 339 | 609 | 79.5 |
| 7: Employee commuting | 1,444 | 1,633 | 1,485 | 1,247 | 830 | -33.4 |
| 12: End-of-life treatment of sold products | 225 | 223 | 207 | 208 | 220 | 5.6 |
| Total | 155,156 | 164,483 | 171,207 | 176,819 | 219,256 | 24.0 |
| CO2 emissions per unit of revenue [t-CO2/billion yen] | 903 | 933 | 938 | 950 | 1,149 | 20.9 |
- Categories 8, 10, 11, 13-15, which are not applicable to our business activities, and Category 9, which is difficult to calculate at this time, are excluded from the list.
Greenhouse gas (CO2) emissions reporting boundary
- Scopes 1 and 2: All of the facilities and sales offices in Japan, and major production facility in other countries (Suzhou Plant in China)
- Scope 3 Category 2: The consolidated companies of the Santen Group
- Scope 3 Category 3: All of the facilities and sales offices of the Santen Group in Japan
Greenhouse gas (CO2) emissions calculation standards
| Scope1 | CO2 emissions associated with fuel use <Calculation method> Calculated based on fuel consumption x heating value per unit x fuel CO2 emission factor <Emission factor> Emission factor based on "GHG Emissions Accounting, Reporting, and Disclosure System" (Ministry of the Environment) |
|---|---|
| Scope2 | CO2 emissions from the purchase of electricity and heat <Calculation method> Calculated based on electricity consumption x electricity CO2 emission factor + heat usage x heat CO2 emission factor. <Emission factor> (Japan) Electricity & Heat: Emission factor based on "GHG Emissions Accounting, Reporting, and Disclosure System" (Ministry of the Environment) (China) Electricity: Emission factor of "2022 Corporate Greenhouse Gas Emission Notification Management Relations Priority Work Notification" (China Environmental Environment Department) |
| Scope3 | CO2 emissions through the supply chain <Calculation method> Calculated by the method of receiving emission volumes from suppliers. Or, calculated by multiplying the amount of activity in each category collected by the company by the emissions intensity based on the "Emissions intensity database for calculating greenhouse gas emissions of organizations through the supply chain (ver. 3.2)" (Ministry of the Environment, Ministry of Economy, Trade and Industry) <Emission factor>
|
Energy usage trend
| FY2017 | FY2018 | FY2019 | FY2020(1) | FY2021(2) | % Change (2) / (1) | |
|---|---|---|---|---|---|---|
| Energy usage(*1,2) | 656,715 | 668,462 | 651,669 | 610,368 | 635,562 | 4.1 |
| Energy usage per unit of revenue(*1) [GJ/billion yen] | 2,919 | 2,856 | 2,698 | 2,445 | 2,387 | -2.4 |
- In order to improve data accuracy, energy usage and energy usage per unit of revenue are retroactively revised from FY2019 onward.
- Energy for gasoline from commercial vehicles added since FY2021.
| Operational site | FY2017 | FY2018 | FY2019 | FY2020(1) | FY2021(2) | % Change (2) / (1) |
|---|---|---|---|---|---|---|
| Shimoshinjo Office | 7,122 | 6,085 | 5,333 | 4,624 | 4,171 | -9.8 |
| Noto Plant | 238,837 | 241,750 | 248,878 | 250,863 | 237,273 | -5.4 |
| Shiga Product Supply Center | 158,305 | 159,485 | 153,698 | 154,389 | 151,794 | -1.7 |
| Nara Research and Development Center | 96,359 | 95,572 | 97,865 | 95,696 | 98,028 | 2.4 |
| Branch and Sales offices and others(*) | 8,522 | 3,954 | 4,050 | 3,099 | 35,380 | 1,041.8 |
| Suzhou Plant (China) | 97,256 | 111,632 | 106,503 | 101,698 | 108,916 | 7.1 |
| Tampere Plant (Finland) | 50,314 | 49,984 | 35,342 | - | - | - |
| Total | 656,715 | 668,462 | 651,669 | 610,368 | 635,562 | 4.1 |
- Energy for gasoline from commercial vehicles added since FY2021.
Renewable energy trend
| Type | FY2017 | FY2018 | FY2019 | FY2020(1) | FY2021(2) | % Change (2) / (1) |
|---|---|---|---|---|---|---|
| Solar energy generation(*1) | 13 | 11 | 12 | 12 | 12 | -5.5 |
| Purchased renewable energy(*2) | 554 | 581 | 1,591 | - | 6,547 | - |
| Total | 567 | 592 | 1,603 | 12 | 6,559 | 54,558.4 |
- Generated by solar energy equipment installed in Nara Research and Development Center. Not included in energy consumption.
- Purchased from energy companies and included in energy consumption.
Environmental Load Reduction
| FY2017 | FY2018 | FY2019 | FY2020(1) | FY2021(2) | % Change (2) / (1) | |
|---|---|---|---|---|---|---|
| Total waste recycled/ reused | 2,814 | 2,888 | 3,065 | 2,951 | 2,662 | -9.8 |
| Total waste disposed | 2,910 | 3,178 | 3,201 | 2,985 | 2,702 | -9.5 |
| Waste landfilled | 62 | 254 | 107 | 9.5 | 14 | 45.0 |
| Waste incinerated with energy recovery | 585 | 890 | 743 | 772 | 637 | -17.6 |
| Waste incinerated without energy recovery | 0 | 0 | 0 | 0 | 22 | - |
| Waste otherwise disposed | 1,945 | 1,799 | 2,245 | 2,161 | 2,074 | -4.0 |
| Recycling rate | 96.7% | 90.9% | 95.8% | 98.9% | 98.5% | -0.4ppt |
| Waste disposal per unit of revenue [t/billion yen] | 12.9 | 13.6 | 13.3 | 12.0 | 10.1 | -15.2 |
| Operational site | FY2017 | FY2018 | FY2019 | FY2020(1) | FY2021(2) | % Change (2) / (1) | |
|---|---|---|---|---|---|---|---|
| Noto Plant | Emissions | 1,686 | 1,793 | 1,865 | 1,716 | 1,649 | -3.9 |
| Recycled resources | 1,686 | 1,793 | 1,865 | 1,716 | 1,649 | -3.9 | |
| Final disposal | 0.1 | 0.1 | 0.1 | 0.1 | 0.1 | 40.0 | |
| Shiga Product Supply Center | Emissions | 711 | 671 | 743 | 837 | 668 | -20.3 |
| Recycled resources | 711 | 671 | 743 | 837 | 668 | -20.3 | |
| Final disposal | 0.0 | 0.0 | 0.0 | 0.0 | 0.0 | - | |
| Nara Research and Development Center | Emissions | 53 | 73 | 80 | 54 | 63 | 16.8 |
| Recycled resources | 51 | 72 | 78 | 52 | 61 | 16.7 | |
| Final disposal | 0.1 | 0.1 | 0.1 | 0.1 | 0.1 | 20.0 | |
| Suzhou Plant (China)(*1) | Emissions | 117 | 148 | 179 | 248 | 153 | -38.2 |
| Recycled resources | 57 | 54 | 75 | 220 | 118 | -46.3 | |
| Final disposal | 60 | 94 | 104 | 9.2 | 13 | 46.4 | |
| Branch and Sales offices and others(*2) | Emissions | 83 | 231 | 99 | 130 | 169 | 30.1 |
| Recycled resources | 78 | 62 | 90 | 126 | 166 | 32.2 | |
| Final disposal | 0.2 | 159.4 | 0.2 | 0.2 | 0.1 | -15.4 | |
- Due to setting the long-term target, we confirmed the treatment status of the waste disposal contractor at the Suzhou Plant and reviewed the aggregation method from FY2020.
- Waste emissions from Branch and Sales offices and others increased temporarily due to the disposal of residual equipment, etc. associated with the sale of the former head office and the Osaka factory in FY2018.
Hazardous Waste
We have defined as "Hazardous Wastes," according to the laws and regulations of each country, substances that fall under specially controlled industrial waste as stipulated in the "Waste Disposal and Public Cleansing Act" in Japan, and substances to be treated as dangerous waste in China. We started collecting data from FY2020.
| FY2017 | FY2018 | FY2019 | FY2020(1) | FY2021(2) | % Change (2) / (1) | |
|---|---|---|---|---|---|---|
| Japan (Specially controlled industrial waste emissions) | - | - | - | 13 | 20 | 56.9 |
| Total hazardous waste recycled/ reused | - | - | - | - | 20 | - |
| Hazardous waste landfilled | - | - | - | - | 0 | - |
| Hazardous waste incinerated with energy recovery | - | - | - | - | 20 | - |
| Hazardous waste incinerated without energy recovery | - | - | - | - | 0 | - |
| Hazardous waste recycled through other methods | - | - | - | - | 0 | - |
| China (hazardous waste) | - | - | - | 152 | 70 | -54.1 |
| Total hazardous waste recycled/ reused | - | - | - | - | 44 | - |
| Hazardous waste landfilled | - | - | - | - | 4 | - |
| Hazardous waste incinerated with energy recovery | - | - | - | - | 44 | - |
| Hazardous waste incinerated without energy recovery | - | - | - | - | 22 | - |
| Hazardous waste recycled through other methods | - | - | - | - | 0 | - |
| Total | - | - | - | 164 | 89 | -45.6 |
| Hazardous waste disposal per unit of revenue [t/billion yen] | - | - | - | 0.7 | 0.3 | -49.1 |
Air pollutants emission trend
| Substance | FY2017 | FY2018 | FY2019 | FY2020(1) | FY2021(2) | % Change (2) / (1) |
|---|---|---|---|---|---|---|
| SOx (sulfur oxides)(*1,2) | 6.1 | 2.2 | 1.8 | 1.3 | 1.5 | 15.9 |
| NOx (nitrogen oxides)(*1,2) | 8.3 | 4.0 | 3.9 | 4.4 | 4.2 | -5.4 |
| VOC (volatile organic compounds)(*2) | 36 | 41 | 46 | 42 | 45 | 8.3 |
- Emissions are estimated based on results from regular examinations.
- The Suzhou Plant in China is excluded until FY2019.
Water pollutants emissions trend
| Substance | FY2017 | FY2018 | FY2019 | FY2020(1) | FY2021(2) | % Change (2) / (1) |
|---|---|---|---|---|---|---|
| BOD (biochemical oxygen demand)(*1,2) | 4.5 | 8.7 | 8.8 | 4.8 | 3.4 | -28.5 |
| COD (chemical oxygen demand)(*1,2) | 4.8 | 7.5 | 7.1 | 4.5 | 4.8 | 8.2 |
- Emissions are estimated based on results from regular examinations.
- The Suzhou Plant in China is excluded until FY2019.
PCB storage
We have no PCB-containing equipment at our business sites.
In March 2017, through a nationally designated service provider, we completed the appropriate disposal of the three PCB-containing fluorescent light ballasts that had been stored at our former Osaka Plant by rendering them harmless.
| FY2017 | FY2018 | FY2019 | FY2020(1) | FY2021(2) | % Change (2) / (1) | |
|---|---|---|---|---|---|---|
| Polychlorinated biphenyl holdings [kg] | 0 | 0 | 0 | 0 | 0 | - |
Water usage trend
| FY2017 | FY2018 | FY2019 | FY2020(1) | FY2021(2) | % Change (2) / (1) | ||
|---|---|---|---|---|---|---|---|
| Water usage Total | Usage | 545 | 559 | 588 | 542 | 521 | -3.8 |
| Water usage per unit of revenue [thousand m3/billion yen] | Usage | 2.42 | 2.39 | 2.43 | 2.17 | 1.96 | -9.8 |
| Water usage per Production quantity [m3/10,000 units] | Usage | - | - | 12.4 | 12.1 | 13.4 | 9.9 |
| Operational site | FY2017 | FY2018 | FY2019 | FY2020(1) | FY2021(2) | % Change (2) / (1) | |
|---|---|---|---|---|---|---|---|
| Noto Plant | Usage | 300 | 294 | 343 | 332 | 313 | -5.7 |
| Discharge | 291 | 286 | 296 | 281 | 268 | -4.3 | |
| Shiga Product Supply Center | Usage | 115 | 107 | 93 | 111 | 99 | -10.8 |
| Discharge | 91 | 93 | 93 | 92 | 92 | 0.5 | |
| Nara Research and Development Center | Usage | 46 | 55 | 52 | 44 | 45 | 4.0 |
| Discharge | 35 | 43 | 38 | 31 | 32 | 3.0 | |
| Branch and Sales offices and others | Usage | 4.2 | 3.9 | 2.9 | 2.1 | 1.7 | -19.1 |
| Discharge | 4.2 | 3.9 | 2.9 | 2.1 | 1.6 | -25.3 | |
| Suzhou Plant (China) | Usage | 40 | 58 | 61 | 53 | 62 | 16.6 |
| Discharge | - | - | - | - | 23 | - | |
<Reference>Environmental Data (Japan)
Overview of Environmental Load (2021)
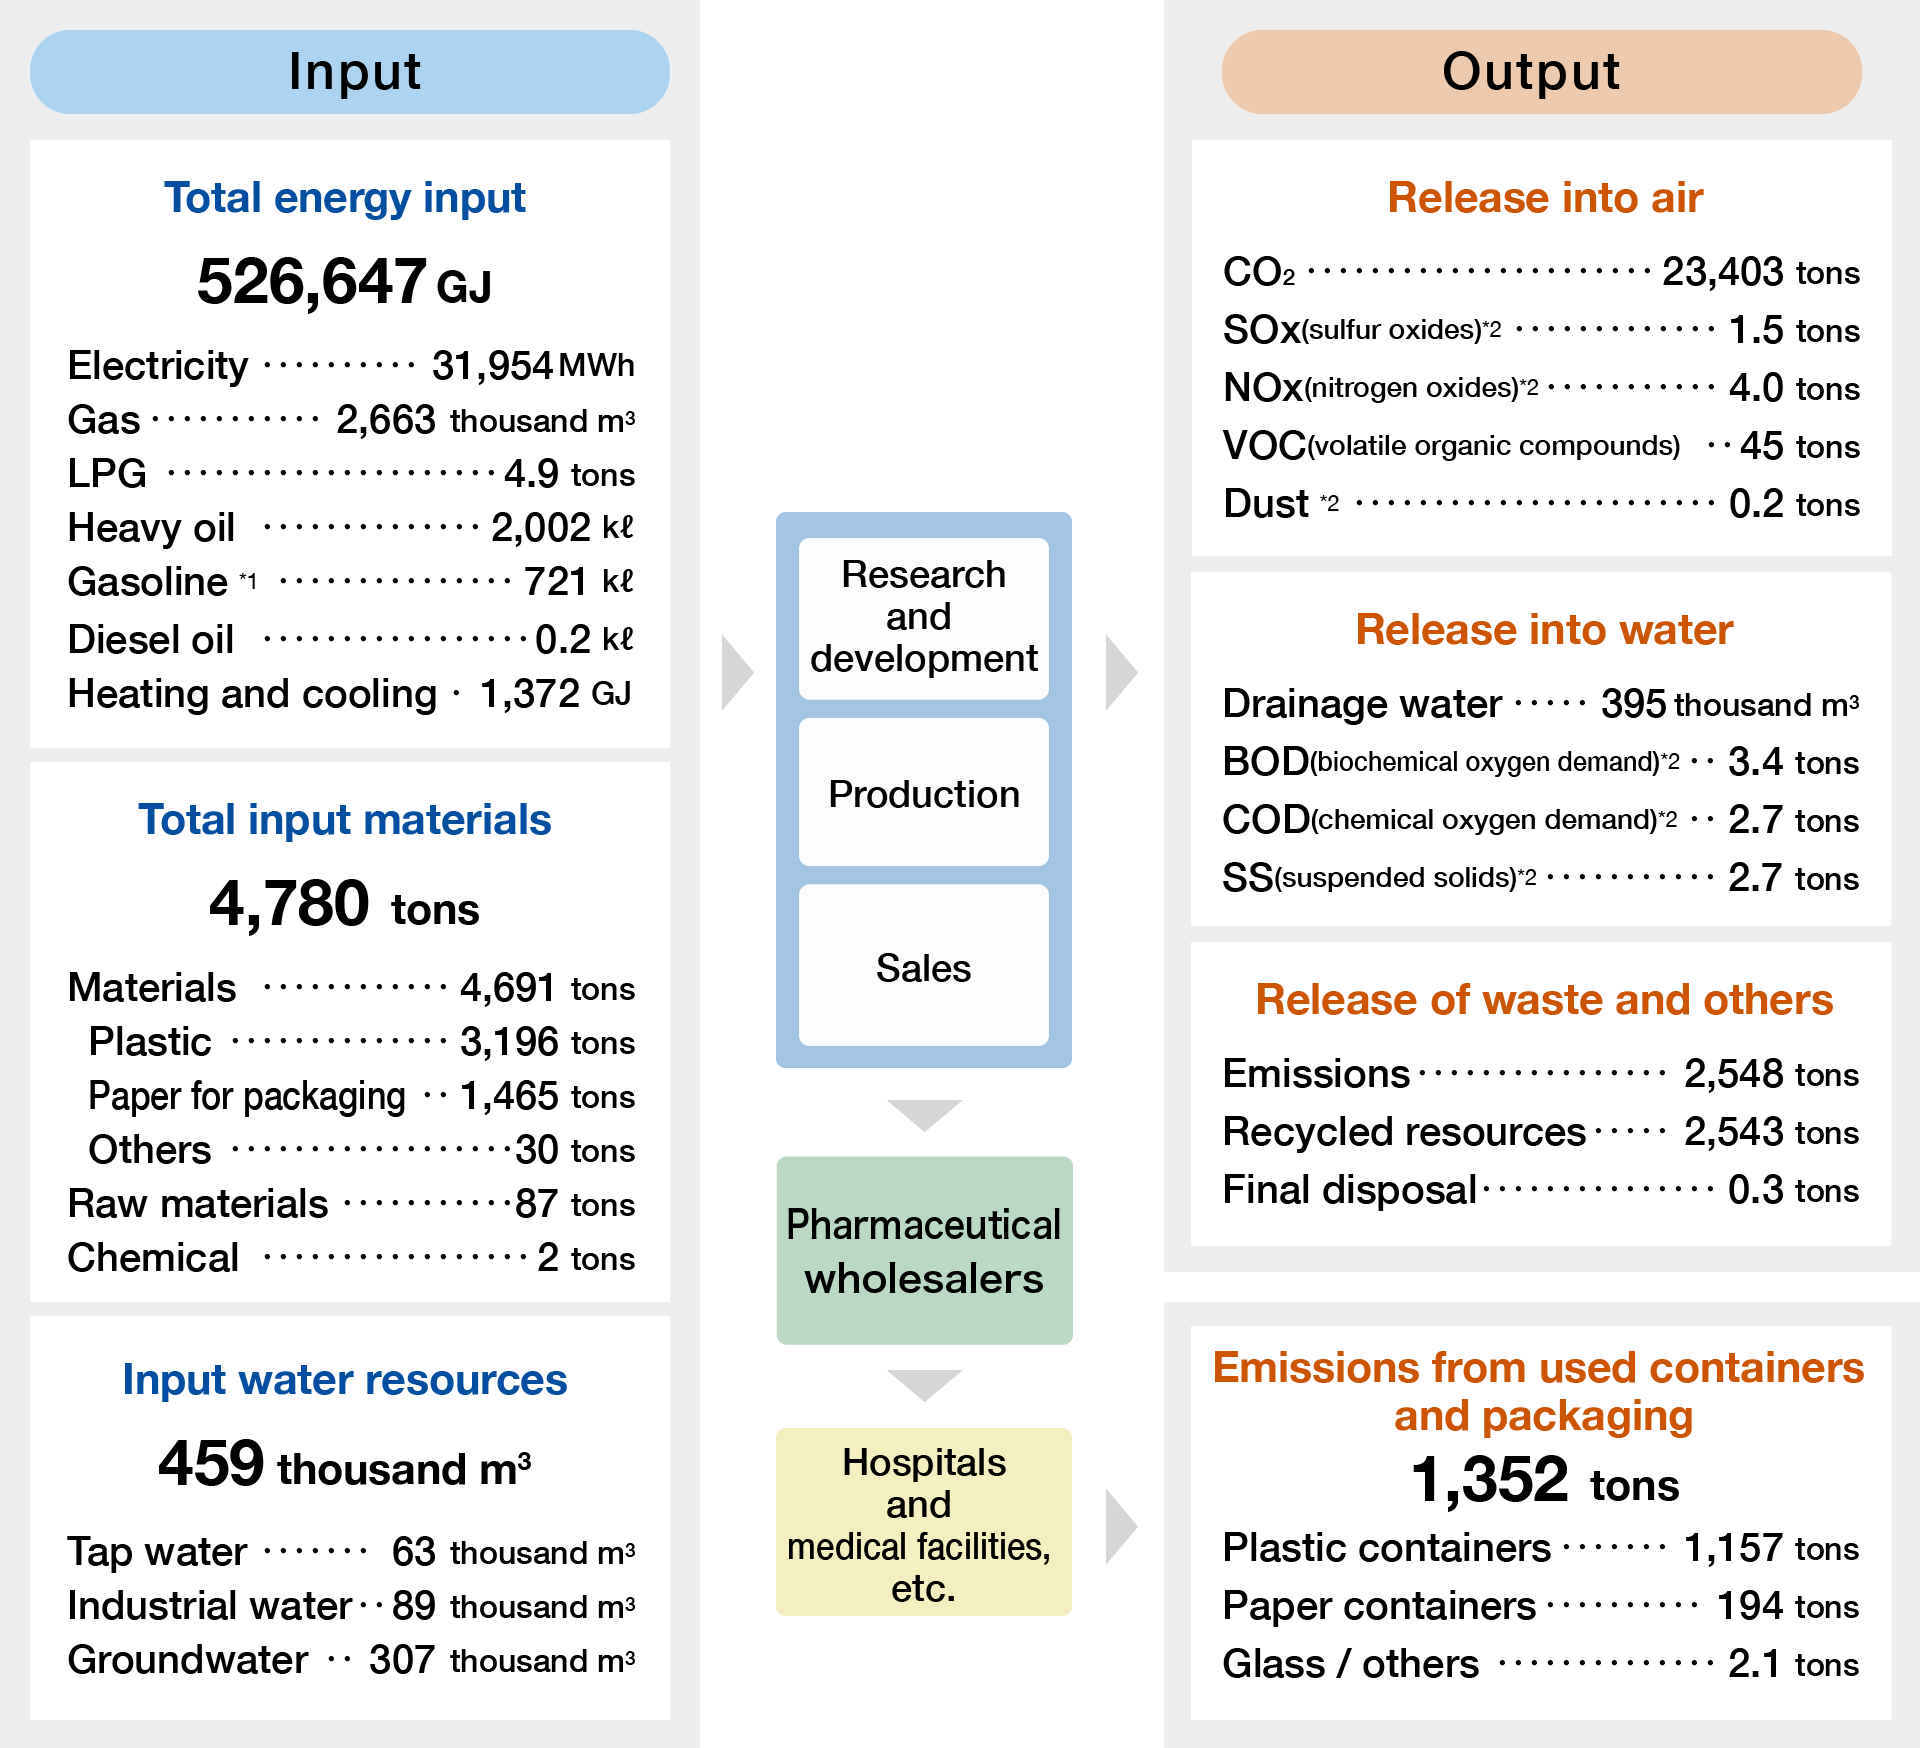
- Gasoline input is mainly input from commercial vehicle.
- Emission is based on results from regular examinations.
Greenhouse gas (CO2) emissions trend by scope
| FY2017 | FY2018 | FY2019 | FY2020(1) | FY2021(2) | % Change (2) / (1) | |
|---|---|---|---|---|---|---|
| Greenhouse gas (CO2) emissions trend by scope | 24,867 | 24,804 | 28,877 | 27,742 | 26,737 | -3.6 |
| Scope1 | 14,464 | 14,390 | 13,783 | 13,378 | 13,212 | -1.2 |
| Scope2 (Market-based) | - | - | 14,378 | 13,963 | 10,191 | -27.0 |
| Scope2 (Location-based) | 10,403 | 10,414 | 15,094 | 14,364 | 13,525 | -5.8 |
| CO2 emissions per unit of revenue [t-CO2/billion yen] | 145 | 144 | 154 | 147 | 123 | -16.5 |
Energy usage
| FY2017 | FY2018 | FY2019 | FY2020(1) | FY2021(2) | % Change (2) / (1) | |
|---|---|---|---|---|---|---|
| Energy usage | 509,145 | 506,846 | 509,824 | 508,670 | 526,647 | 3.5 |
| Energy usage per unit of revenue[GJ/billion yen] | 2,962 | 2,876 | 2,792 | 2,733 | 2,760 | 1.0 |
Waste reduction and recycling trend
| FY2017 | FY2018 | FY2019 | FY2020(1) | FY2021(2) | % Change (2) / (1) | |
|---|---|---|---|---|---|---|
| Emissions | 2,533 | 2,768 | 2,787 | 2,737 | 2,548 | -6.9 |
| Recycled resources | 2,526 | 2,597 | 2,777 | 2,731 | 2,543 | -6.9 |
| Final disposal | 0.4 | 159.6 | 0.4 | 0.3 | 0.3 | 3.6 |
PRTR substances handled
| Substance | FY2017 | FY2018 | FY2019 | FY2020(1) | FY2021(2) | % Change (2) / (1) |
|---|---|---|---|---|---|---|
| Acetonitrile | 1.8 | 1.9 | 1.8 | 1.9 | 2.1 | 15.5 |
| Boron and its compounds | 1.0 | 0.6 | 0.7 | 0.6 | 0.6 | 5.7 |
| Xylene | 0.6 | 0.4 | 0.2 | 0.4 | 0.3 | -34.5 |
Prevention of environmental pollution
| Noto Plant | Shiga Product Supply Center | Nara Research and Development Center | ||||||
|---|---|---|---|---|---|---|---|---|
| Criteria | Results | Criteria | Results | Criteria | Results | |||
| Air pollution | Soot and dust | [g/Nm3] | 0.3 | 0.01 | 0.2 | <0.005 | 0.1 | 0.001 |
| NOx | [ppm] | 150 | 53 | 180 | 29 | 150 | 32 | |
| SOx | [Nm3/h] | 0.98 | 0.02 | - | - | - | - | |
| Water contamination | pH | 5.8∼8.6 | 7.4∼7.8 | 5.0∼9.0 | 7.2∼8.2 | 5.0∼9.0 | 6.2∼8.1 | |
| BOD | [mg/L] | 80 | 5.5 | 600 | 30 | 1,500 | 95 | |
| COD | [mg/L] | 80 | 6.6 | 600 | 26 | - | - | |
| SS | [mg/L] | 120 | 8 | 600 | 35 | 1,500 | 140 | |
| Noise | Morning | [dB] | 60 | 49 | 50 | 45 | 60 | 42 |
| Noon | [dB] | 65 | 51 | 55 | 46 | 65 | 44 | |
| Evening | [dB] | 60 | 48 | 50 | 46 | 60 | 42 | |
| Night | [dB] | 50 | 49 | 45 | 44 | 50 | 41 | |
| Vibration levels | Noon | [dB] | 65 | 44 | 70 | <25 | 65 | 27 |
| Night | [dB] | 60 | 43 | 65 | <25 | 60 | <25 | |
Criteria values are specified according to the agreements with the municipalities where the workplaces are located.
Environmental accounting (Japan)
| Category | FY2020 | FY2021 | |||
|---|---|---|---|---|---|
| Investments | Expenses | Investments | Expenses | ||
| Business area costs | 51.8 | 168.7 | 5.4 | 149.0 | |
| Pollution prevention | 0.0 | 55.2 | 3.7 | 64.7 | |
| Global environmental conservation | 51.8 | 69.3 | 1.8 | 53.4 | |
| Resource circulation | 0.0 | 44.1 | 0.0 | 30.9 | |
| Upstream/downstream costs | - | 9.9 | - | 11.5 | |
| Administration costs | 2.0 | 105.2 | 2.9 | 131.4 | |
| R&D costs | - | - | - | - | |
| Social activity costs | - | 1.4 | - | 1.4 | |
| Environmental damage costs | - | 0.2 | - | 99.1 | |
| Total | 53.8 | 285.4 | 8.4 | 392.4 | |
- Only cases that can be determined as related to the purpose of environmental conservation are included in the calculations.
- The cost includes the depreciation amount and is accounted for in the same way as in accounting.
- Current investment includes both the investment amount and expenses.
- The total number is only a rough estimate because the totals are rounded off.
- The employment cost of the environmental management department and the operation and maintenance of the environmental management system are accounted for as administration costs.
- "-" means no cost or no activities.
| Category | FY2020 | FY2021 |
|---|---|---|
| Profits from sales of waste etc | 55.9 | 57.5 |
| Cost reductions | 15.7 | 13.2 |
- Only economic effects that can be determined with a high degree of certainty are included in the calculation.
| Category | unit | FY2020 | FY2021 | Environmental burden reduction | % Change (2) / (1) | |
|---|---|---|---|---|---|---|
| Energy | Total energy usage | GJ | 508,670 | 526,647 | -17,977 | 3.5 |
| Electricity | kWh | 32,090 | 31,054 | 1,036 | -3.2 | |
| Gas | thousand m3 | 2,613 | 2,663 | -50 | 1.9 | |
| LPG | Tons | 5.1 | 4.9 | 0.2 | -4.2 | |
| Heavy Oil | kℓ | 2,192 | 2,002 | 190 | -8.7 | |
| Gasoline | kℓ | 619 | 721 | -101 | 16.4 | |
| Heating and Cooling | GJ | 1,469 | 1,372 | 98 | -6.6 | |
| Water resources | Total water usage | thousand m3 | 488 | 459 | 29 | -6.0 |
| Tap water | thousand m3 | 58 | 63 | -5 | 8.2 | |
| Industrial water | thousand m3 | 104 | 89 | 15 | -14.6 | |
| Well water | thousand m3 | 326 | 307 | 19 | -5.8 | |
| Materials | Raw and other materials | tons | 5,131 | 4,778 | 353 | -6.9 |
| Global warming | CO2(*) | tons | 27,340 | 23,403 | 3,937 | -14.4 |
| Atmospheric pollutants | SOx (sulfur oxides) | tons | 1.3 | 1.5 | -0.2 | 15.9 |
| NOx (nitrogen oxides) | tons | 3.9 | 4.0 | 0.0 | 0.9 | |
| VOC (volatile organic compounds) | tons | 42 | 45 | -3 | 8.4 | |
| Dust | tons | 0.2 | 0.2 | 0.0 | 2.5 | |
| Water pollutants | Discharged water | thousand m3 | 406 | 395 | 11 | -2.8 |
| BOD (biochemical oxygen demand) | tons | 4.8 | 3.4 | 1.4 | -28.5 | |
| COD (chemical oxygen demand) | tons | 2.6 | 2.7 | -0.1 | 3.1 | |
| SS (suspended solids) | tons | 7.2 | 5.2 | 2.0 | -28.0 | |
| Waste materials | Emissions | tons | 2,737 | 2,548 | 188 | -6.9 |
| Recycled resources | tons | 2,731 | 2,543 | 187 | -6.9 | |
| Final disposal | tons | 0.3 | 0.3 | 0.0 | 3.6 | |
- CO₂ conversion on Market-based
note
Reporting boundary
Japan: all facilities including sales offices.
Other countries: Principal production facilities, Suzhou Plant (China).
Guidelines referenced
These data have been prepared with reference to the Environmental Reporting Guidelines (2018 edition, Ministry of the Environment of Japan), the Basic Guidelines on Accounting for Greenhouse Gas Emissions Throughout the Supply Chain (Ministry of the Environment of Japan / Ministry of Economy, Trade and Industry of Japan, Ver. 2.3), the Environmental Accounting Guideline (2005 edition, the Ministry of the Environment of Japan), the Greenhouse Gas Protocol, and the GRI Standards.
Numerical results
Total numbers may not always match, due to the effect of rounding and other reasons.