2021.3 | 2022.3 | |
---|---|---|
Revenue | 249,605 | 266,257 |
Cost of sales | (98,221) | 109,671 |
(Percent of revenue) (%) | 39.4 | 41.2 |
Gross profit | 151,384 | 156,586 |
(Percent of revenue) (%) | 60.6 | 58.8 |
Selling, general and administrative expenses | (79,554) | (84,499) |
(Percent of revenue) (%) | 31.9 | 31.7 |
Amortization on intangible assets associated with products | (10,650) | (9,734) |
(Percent of revenue) (%) | 4.3 | 3.7 |
Research and development expenses | (24,112) | 26,377 |
(Percent of revenue) (%) | 9.7 | 9.9 |
Other income | 16,007 | 1,043 |
Other expenses | (40,889) | (1,133) |
Operating profit | 12,187 | 35,886 |
(Percent of revenue) (%) | 4.9 | 13.5 |
Finance income | 1,346 | 2,543 |
Finance expenses | (1,488) | (1,209) |
Share of loss of investments accounted for using equity method | (358) | (1,604) |
Profit before tax | 11,688 | 35,616 |
(Percent of revenue) (%) | 4.7 | 13.4 |
Income tax expenses | (2,562) | (8,427) |
Net profit for the year | 9,126 | 27,189 |
(Percent of revenue) (%) | 3.7 | 10.2 |
ROE (%) | 3.0 | 8.4 |
2021.3 | 2022.3 | |
---|---|---|
Revenue | 249,605 | 266,257 |
Cost of sales | (98,221) | (109,671) |
(Percent of revenue) (%) | 39.4 | 41.2 |
Gross profit | 151,384 | 156,586 |
(Percent of revenue) (%) | 60.6 | 58.8 |
Selling, general and administrative expenses | (77,171) | (83,861) |
(Percent of revenue) (%) | 30.9 | 31.5 |
Research and development expenses | (24,112) | (26,377) |
(Percent of revenue) (%) | 9.7 | 9.9 |
Operating profit | 50,101 | 46,348 |
(Percent of revenue) (%) | 20.1 | 17.4 |
Net profit for the year | 37,549 | 35,159 |
(Percent of revenue) (%) | 15.0 | 13.2 |
ROE (%) | 12.3 | 10.9 |
2021.3 | 2022.3 | |||
---|---|---|---|---|
% | % | |||
Non-current assets | ||||
Property, plant and equipment | 39,489 | 9.7 | 56,287 | 12.2 |
Intangible assets | 112,876 | 28.1 | 130,217 | 28.3 |
Financial assets | 31,903 | 7.9 | 28,673 | 6.2 |
Retirement benefit asset | 1,619 | 0.4 | 3,011 | 0.7 |
Investments from application of equity method | 5,162 | 1.3 | 7,565 | 1.6 |
Deferred tax assets | 2,824 | 0.7 | 3,103 | 0.7 |
Other non-current assets | 2,249 | 0.6 | 1,695 | 0.4 |
Total non-current assets | 199,054 | 49.1 | 230,551 | 50.1 |
Current assets | ||||
Inventories | 41,575 | 10.3 | 37,141 | 8.1 |
Trade and other receivables | 95,992 | 23.7 | 99,591 | 21.7 |
Other financial assets | 527 | 0.1 | 1,293 | 0.3 |
Other current assets | 5,248 | 1.3 | 8,387 | 1.8 |
Cash and cash equivalents | 62,888 | 15.5 | 83,014 | 18.0 |
Total current assets | 206,231 | 50.9 | 229,426 | 49.9 |
Total assets | 405,285 | 100.0 | 459,976 | 100.0 |
2021.3 | 2022.3 | |||
---|---|---|---|---|
% | % | |||
Equity | ||||
Share capital | 8,525 | 2.1 | 8,672 | 1.9 |
Capital surplus | 8,954 | 2.2 | 9,370 | 2.0 |
Treasury shares | (934) | (0.2) | (718) | (0.2) |
Retained earnings | 273,238 | 67.4 | 290,477 | 63.2 |
Other components of equity | 20,283 | 5.0 | 29,688 | 6.5 |
Total equity attributable to owners of the parent | 310,181 | 76.5 | 337,488 | 73.4 |
Non-controlling interests | (535) | (0.1) | (645) | (0.1) |
Total equity | 309,646 | 76.4 | 336,844 | 73.2 |
Liabilities | ||||
Non-current liabilities | ||||
Financial liabilities | 10,141 | 2.5 | 22,023 | 4.8 |
Net defined benefit liabilities | 1,210 | 0.3 | 1,077 | 0.2 |
Provisions | 600 | 0.1 | 738 | 0.2 |
Deferred tax liabilities | 3,626 | 0.9 | 2,526 | 0.5 |
Other non-current liabilities | 1,514 | 0.4 | 948 | 0.2 |
Total non-current liabilities | 17,090 | 4.2 | 27,312 | 5.9 |
Current liabilities | ||||
Trade and other payables | 38,106 | 9.4 | 41,185 | 9.0 |
Other financial liabilities | 23,739 | 5.9 | 38,533 | 8.4 |
Income tax payable | 5,458 | 1.3 | 4,198 | 0.9 |
Provisions | 819 | 0.2 | 939 | 0.2 |
Other current liabilities | 10,428 | 2.6 | 10,965 | 2.4 |
Total current liabilities | 78,549 | 19.4 | 95,821 | 20.8 |
Total liabilities | 95,639 | 23.6 | 123,133 | 26.8 |
Total equity and liabilities | 405,285 | 100.0 | 459,976 | 100.0 |
2021.3 | 2022.3 | |
---|---|---|
Net cash flows from operating activities | 38,808 | 46,043 |
Net cash flows from (used in) investing activities | (53,355) | (35,169) |
Net cash flows from (used in) financing activities | (16,685) | 5,557 |
Net increase (decrease) in cash and cash equivalents | (31,232) | 16,432 |
Cash and cash equivalents at beginning of period | 91,430 | 62,888 |
Effect of exchange rate changes on cash and cash equivalents | 2,690 | 3,694 |
Cash and cash equivalents at end of period | 62,888 | 83,014 |
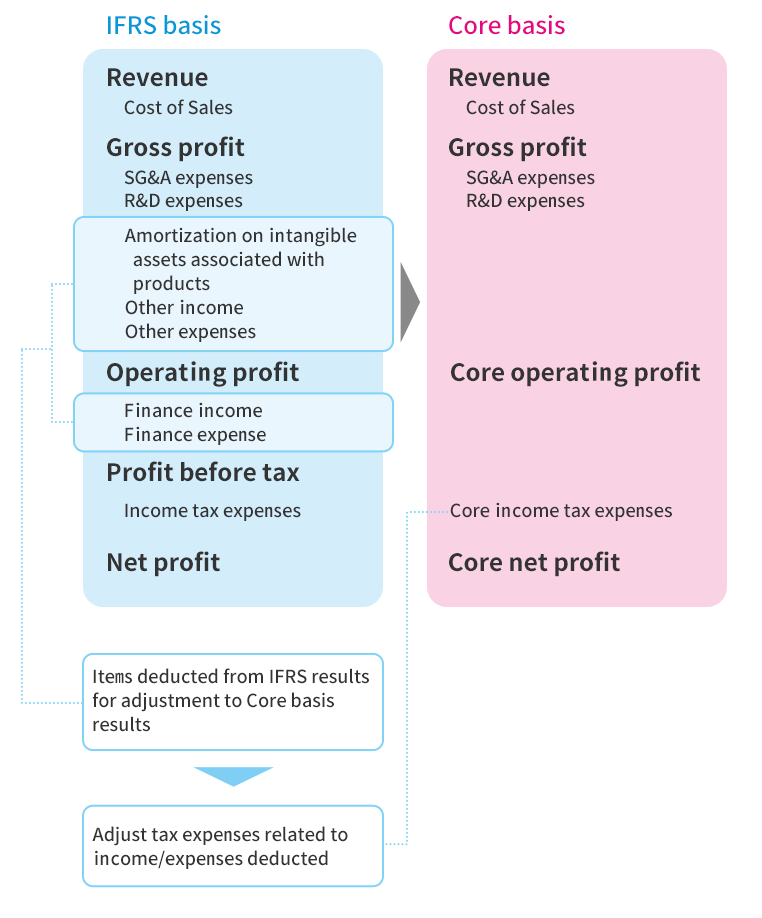
With the adoption of IFRS, the Santen Group discloses financial information on a core basis, which is calculated by excluding certain income and expenses item from the IFRS basis, as an indicator of ordinary performance.